Example usage
Introduction
This tutorial will guide you through the process of using the traders_copilot_mzza_25 package to generate synthetic data, calculate technical indicators, generate trading signals, and visualize the results. By the end of this tutorial, you will be able to:
Generate synthetic financial data.
Calculate Simple Moving Averages (SMA) and Relative Strength Index (RSI).
Generate trading signals based on these indicators.
Visualize the trading signals.
Workflow
Before starting, ensure you have poetry installed.
You can install the necessary packages using pip:
poetry install
Step 1: Import package
First, let’s import the necessary modules.
import sys
import os
sys.path.insert(0, os.path.abspath("../src/traders_copilot_mzza_25"))
from data import generate_synthetic_data
from generate_signals import generate_signals
from indicators import calculate_sma, calculate_rsi
from plot_signals import plot_signals
Step 2: Simulate market data
generate_synthetic_data function simulate and mock stock market data. To create this data, we just feed the function with start_date and end_date. See the following as a reference.
data = generate_synthetic_data(start_date='2024-01-24', end_date='2025-01-24')
data.head()
| Open | High | Low | Close | Adj Close | Volume | |
|---|---|---|---|---|---|---|
| Date | ||||||
| 2024-01-24 00:00:00.000000000 | 99.928843 | 100.044998 | 97.405803 | 99.392452 | 98.998517 | 2326182 |
| 2024-01-25 10:59:45.657370517 | 98.827472 | 100.329171 | 97.915188 | 99.266316 | 99.016852 | 1158981 |
| 2024-01-26 21:59:31.314741035 | 99.092509 | 100.056103 | 97.373548 | 98.581710 | 99.051793 | 3750125 |
| 2024-01-28 08:59:16.972111553 | 98.751133 | 101.501051 | 98.076428 | 99.510424 | 100.140903 | 2286181 |
| 2024-01-29 19:59:02.629482071 | 96.854629 | 98.765622 | 95.809883 | 97.666023 | 98.213417 | 4476945 |
Step 3: Calculate SMA and RSI
Next, we will calculate the 50-day and 200-day Simple Moving Averages (SMA) and the Relative Strength Index (RSI).
df = calculate_sma(data)
df = calculate_sma(df, window=200)
df = calculate_rsi(df)
df.tail().iloc[:, -3:]
| SMA_50 | SMA_200 | RSI | |
|---|---|---|---|
| Date | |||
| 2025-01-18 04:00:57.370517928 | 97.137544 | 95.892522 | 28.366691 |
| 2025-01-19 15:00:43.027888444 | 97.016632 | 95.822201 | 29.214917 |
| 2025-01-21 02:00:28.685258964 | 96.922096 | 95.747801 | 29.825972 |
| 2025-01-22 13:00:14.342629480 | 96.815964 | 95.681511 | 28.945325 |
| 2025-01-24 00:00:00.000000000 | 96.708851 | 95.614732 | 32.431338 |
Step 4: Generating Trading Signals
generate_signals function create a new column that help trader decides to buy or sell the stock The following signals help traders make decisions:
Buy Signal: Indicates a potential buying opportunity.
Sell Signal: Indicates a potential selling opportunity Conditions for a buy signal:
SMA_50 > SMA_200: The short-term trend (50-day SMA) is above the long-term trend (200-day SMA), indicating upward momentum.
RSI < 30: The stock is oversold, suggesting a potential price rebound. Conditions for a sell signal:
SMA_50 < SMA_200: The short-term trend is below the long-term trend, indicating downward momentum.
RSI > 70: The stock is overbought, suggesting a potential price decline.
df = generate_signals(df)
df.tail().iloc[:, -4:]
| SMA_50 | SMA_200 | RSI | Signal | |
|---|---|---|---|---|
| Date | ||||
| 2025-01-18 04:00:57.370517928 | 97.137544 | 95.892522 | 28.366691 | BUY |
| 2025-01-19 15:00:43.027888444 | 97.016632 | 95.822201 | 29.214917 | BUY |
| 2025-01-21 02:00:28.685258964 | 96.922096 | 95.747801 | 29.825972 | BUY |
| 2025-01-22 13:00:14.342629480 | 96.815964 | 95.681511 | 28.945325 | BUY |
| 2025-01-24 00:00:00.000000000 | 96.708851 | 95.614732 | 32.431338 | HOLD |
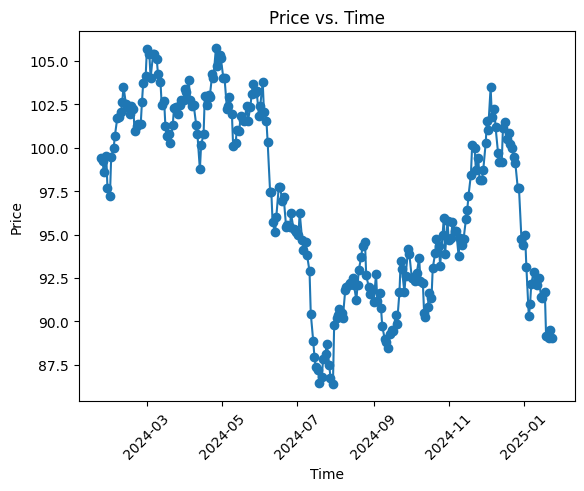
Step 5: Visualizing Trading Signals
For visualization, we can use plot_signals to create a line plot. The chart plots time on x-axis and price on y-axis. Refer to the following code below.
df = df.reset_index()
df['Date'] =  df['Date'].dt.date
plot_signals(df)
Debug: Non-missing Length of Close = 252, Non-missing Length of Date = 252
Conclusion
In this tutorial, we covered how to generate synthetic financial data, calculate technical indicators, generate trading signals, and visualize the results using the traders_copilot_mzza_25 package. You can further explore the package by experimenting with different parameters and indicators.
Next steps
Try modifying the parameters of the generate_synthetic_data function to see how it affects the generated data.
Experiment with different windows for the SMA and RSI calculations.
Explore additional technical indicators and incorporate them into your analysis.